Have you ever wondered how a viral video grows? We've tracked Top Youtubers to see how they spread their content. They tend to publish videos regularly at times that work best for them. There is work behind every video, but there is also data and analysis.
Traditional media does not seem to be disappearing any time soon. But on the other hand, YouTube and other media stars are not a tendency but a reality. And the undeniable truth is that they are here to stay - and grow their audiences.
That's what we'll be covering in this post.
Views count per hour
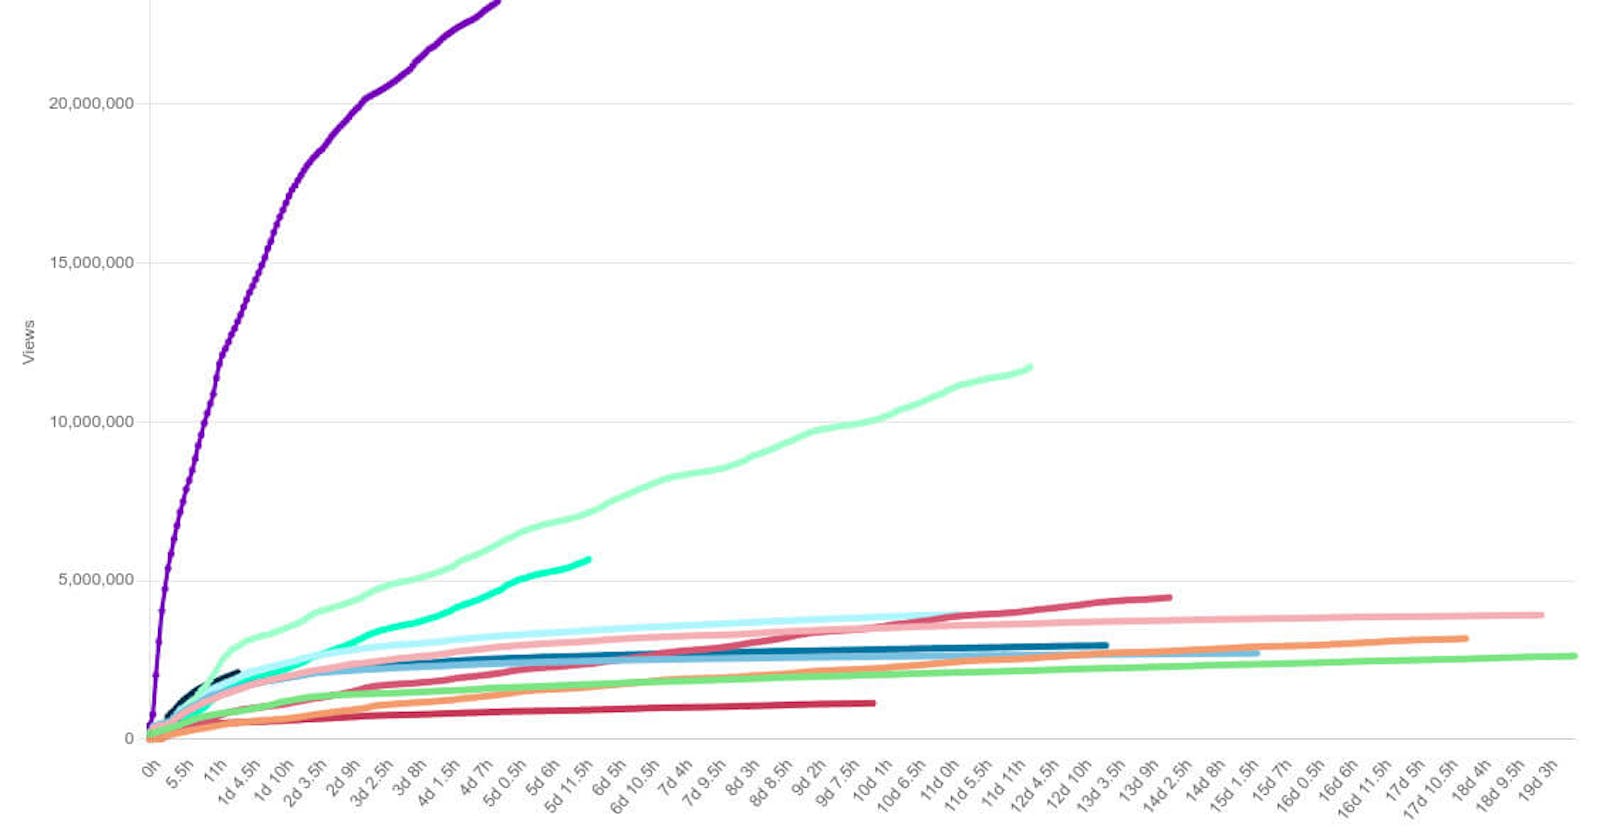
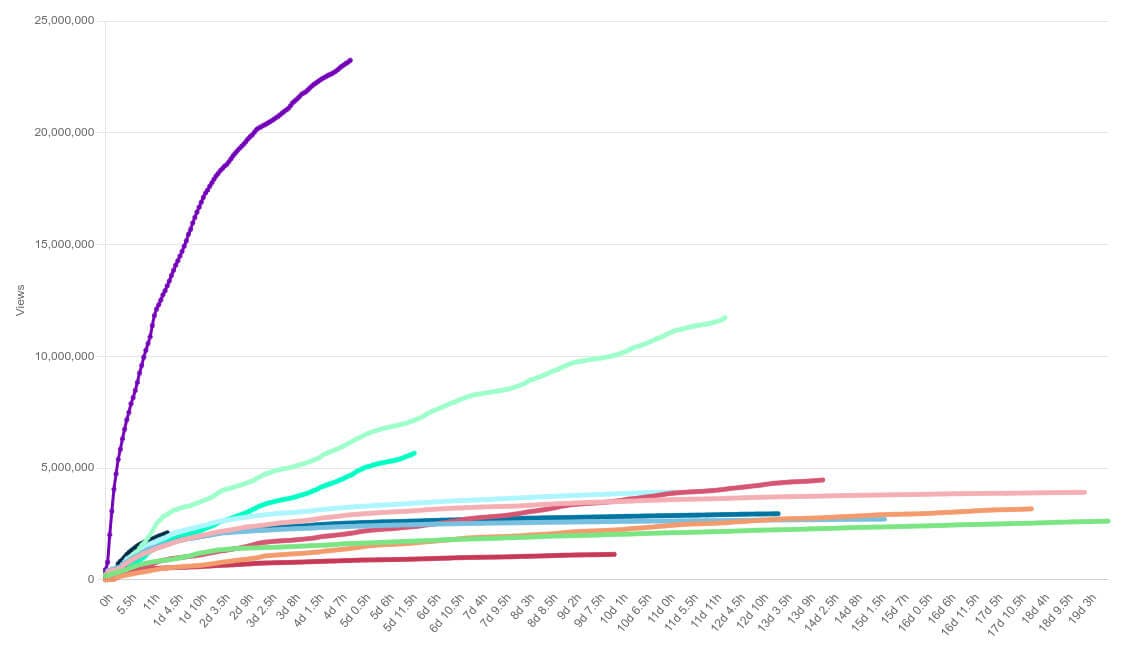
In our first graph, we show the progression of the last published videos. We collected data every 30 minutes, so the timing is as accurate as possible. For a more detailed explanation and dataset, check this small repo we published with the demo .
Here we see the almost exponential growth of some videos in the first hours, some of them reaching a million views in less than a day. Charts are not interactive here, so visit the original post if you want to show or hide videos. Axes will adjust and make it easier to view some trends. Viral videos cause the vertical axis to grow fast. As you can see, that's more than a million views in a few days - even for the ones at the bottom.
After the first explosion, the curve stabilizes, and the growth slows down until it's almost irrelevant. Well, down to "only" hundreds of thousand views per day. These channels keep a short publishing period of under a week, in some cases almost daily. Thus the moment that one of the videos decays, there is another one on the rise. In this way, they may stay trending forever.
Latest videos by PewDiePie
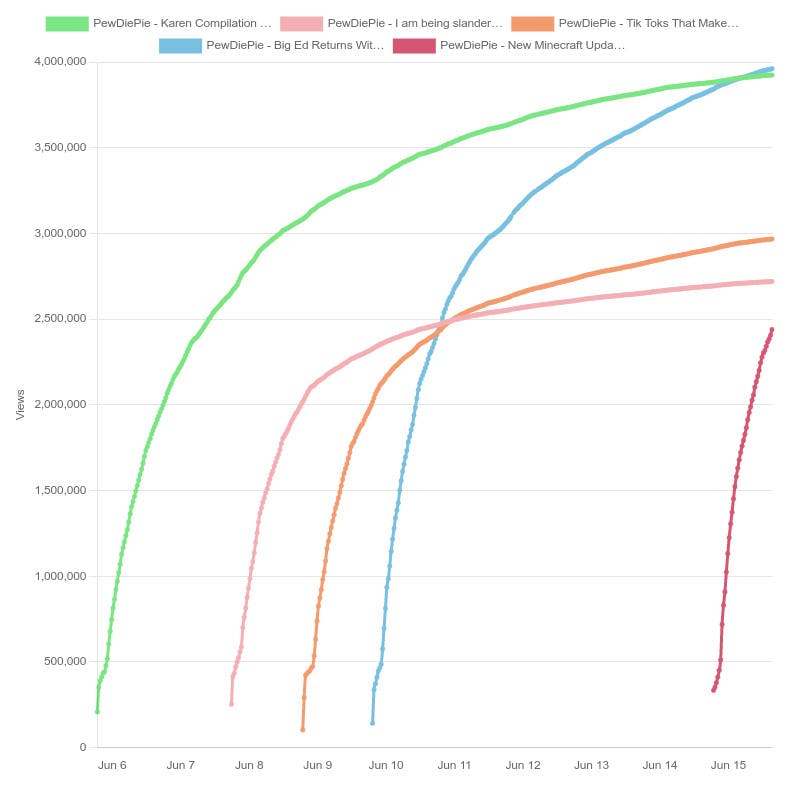
To emphasize this point, we isolated PewDiePie's videos over a few days. He is one of the most followed YouTubers ever with 110 million subscribers at the moment of writing.
As we can see, many people are watching the previous one while the new one is already available. By doing this, they keep steady traffic every day and maintain their position as top content creators. Anyway, this is a clear example of almost-instantly consumed content. Still some views after a few days, but rapidly declining.
The graph shows similar trends between videos, even if they behave differently. Not all of them achieve the same success or go viral. Either way, they all share rapid growth and slowly decay, getting virtually no visits after a week or two.
Channel views per day
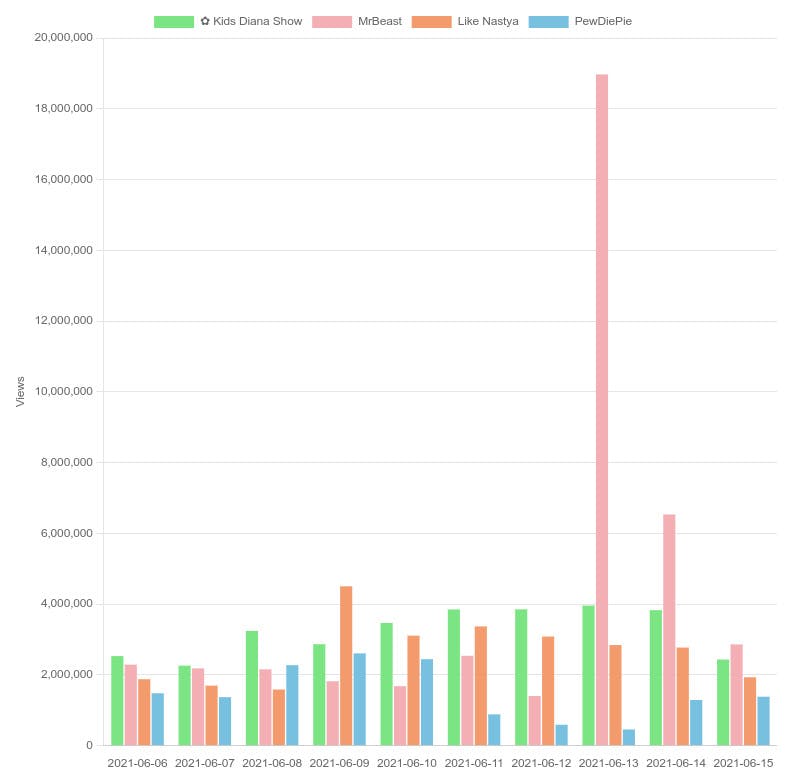
Following the last point mentioned, we group the data per channel and the sum of the visits for the latest fifteen videos. It gives us a reference to the number of people watching them every day. As we've seen previously, each video gets fewer views as time goes by, so we can assume that the latest ones are the right choice to express our point.
There are evident differences from day to day, but the trend is stable. We cannot see the whole picture here, but when a new channel enters with a vast growth is due to a new video - only for channels that do not publish almost daily. Apart from that, there are not many surprises here, and if we were to rank them, there wouldn't be many variations per day.
Unless MrBeast enters the list with a new video that gets ten million views in less than ten hours. Remember that you can click on the channel name above the chart to remove it and readjust the axes on the original post.
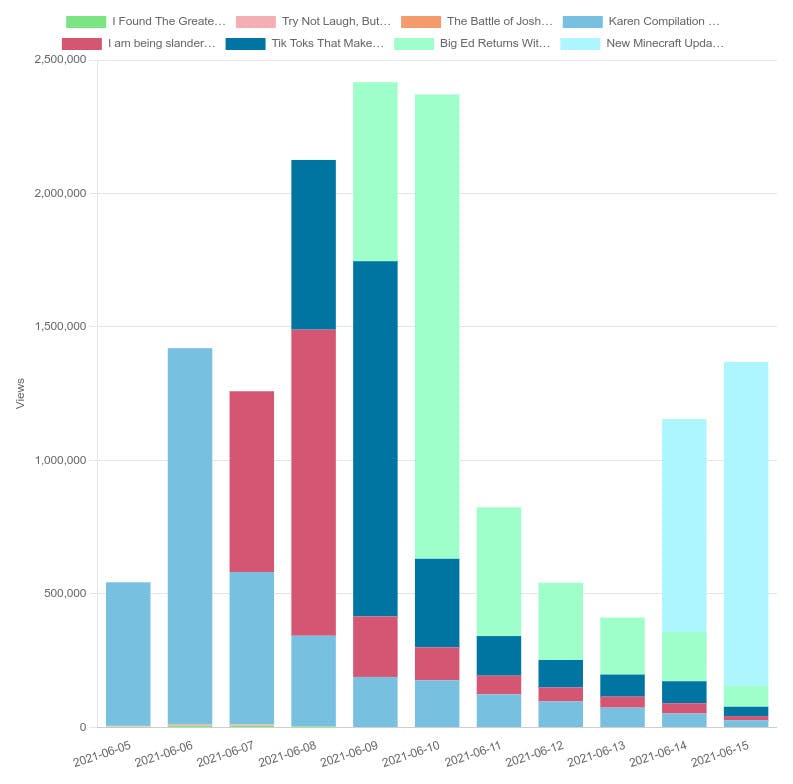
Daily views per video by PewDiePie
In this last graph, we highlight how some videos carry a lot of weight in the daily views, but they decay fast over time. To clarify, we are talking about a Youtuber that generates content daily. That might not apply to different regularities.
In case it wasn't clear yet, we can see the fleeting nature of the content. By following the colors associated with each video, our verdict remains - high spikes after a few hours of being published and slow decay over time. Then a new video comes and takes the bar even higher, maintaining the daily views reasonably stable.
How we obtained the data
YouTube used to show video and channel statistics publicly, but they stopped in 2018. Now we have no official source of information, and many people and companies have been trying to fill that void. There is no easy task to get all this information since they won't just publish it.
With that in mind, we decided to create a recurring Task in Zenrows for top Youtubers. It works almost the same as a one-time task, like the one we show in the Housing Prices article. In this case, we collect less info, just one entry per channel. But we do that over time, gathering data every 30 minutes.
Here is a snippet of the data. The loaded file is incomplete due to its size; we will publish an example dataset in the demo repository.
{
 "channelName": "✿ Kids Diana Show",
 "title": "Diana and Roma Cheer Up Baby Oliver with Music",
 "videoId": "SqiyEsUBe4o",
 "viewCount": 172723,
 "date": 162289398009,
 "channelId": "UCk8GzjMOrta8yxDcKfylJYw"
}
Other use cases
Track and rank influencers As we've seen in these examples, there are several ways of using influencers' collected data over time. More and more companies each day are paying YouTubers and Instagrammers to advertise their products. Knowing which one to contact for a campaign is crucial, and data can help them or marketing agencies decide.
SEO and SEM Wouldn't it be great if we could conveniently position or pay for all the right keywords? Usually, all the competition think the same, so not so convenient after all. That betting war only raises the price without adding any value. But with the correct data, seeing those lowly priced keywords or new similar ones become a great opportunity.
News aggregation What better source of up-to-date texts than news sites? Be it for natural language processing or any other learning mechanism, tons of documents can be gathered daily. By picking the best sources, you can guarantee that the content is high quality and trustworthy.
Conclusion
Line and bar charts are an easy and traditional way of displaying data. The critical point here is the quality of data and how it is processed. It differentiates a mediocre chart from a great source of information that is effortlessly understandable.
Recurrent collection tasks are a great way to gather data points over time for time graphs or comparisons. There are several ways to make the most out of it. Don't hesitate to give it a try.
Originally published at https://www.zenrows.com
